Usage Over Time
Available for plans: Standard - Free, Standard, Premium, Enterprise and Ultimate. |
| A CRM Analytics license is required to view and access CRM Analytics assets in Unified Analytics. |
Monitor Data Usage Trends Over Time
Use the Usage Over Time tab of the Package Usage Overview dashboard to see how the usage of your app changes over time.
Open the ISV Analytics app from the app launcher and navigate to Package Usage Overview. Select the Usage Over Time tab on the dashboard.
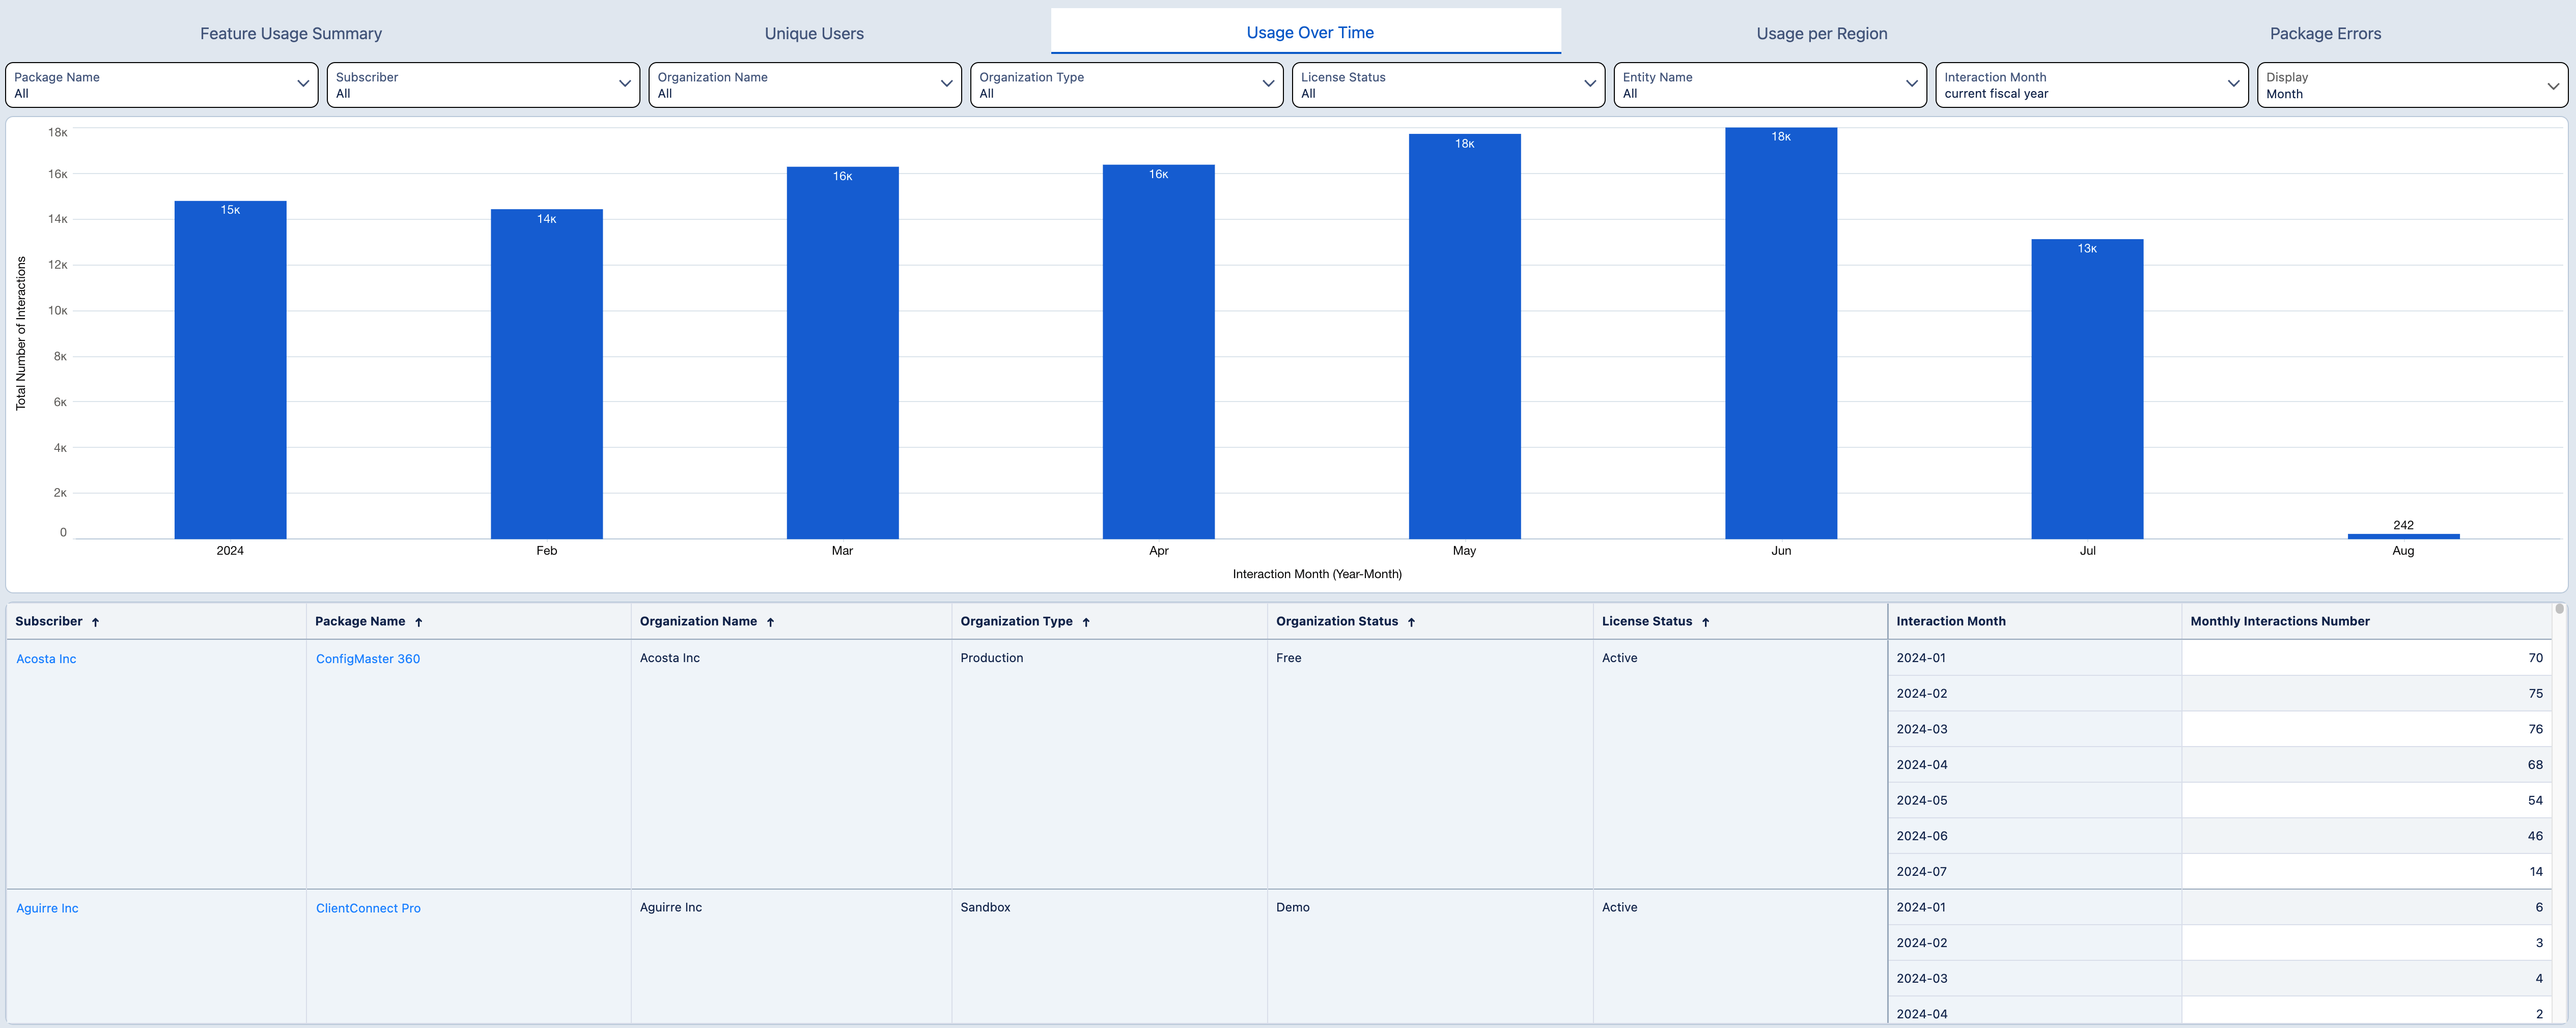
What You Can Do with This Data
Observing how your app's usage changes over time helps you understand your customers better:
- Identify usage patterns over time. Is there a season when your app has more usage? Did a particular global event influence your customers' behavior?
- Determine the best times of the year to concentrate on marketing.
- Assess whether the latest release increased the usage of your app.
Change the Time Grouping
By default, the dashboard shows app usage over time grouped by specific months. You can change this using the Display option to compare usage between months, quarters, or years. Combine this with the Interaction Date filter to adjust the desired timeframe. You can read more about Package Usage Overview dashboard filters in this article: Package Usage Overview Filters.
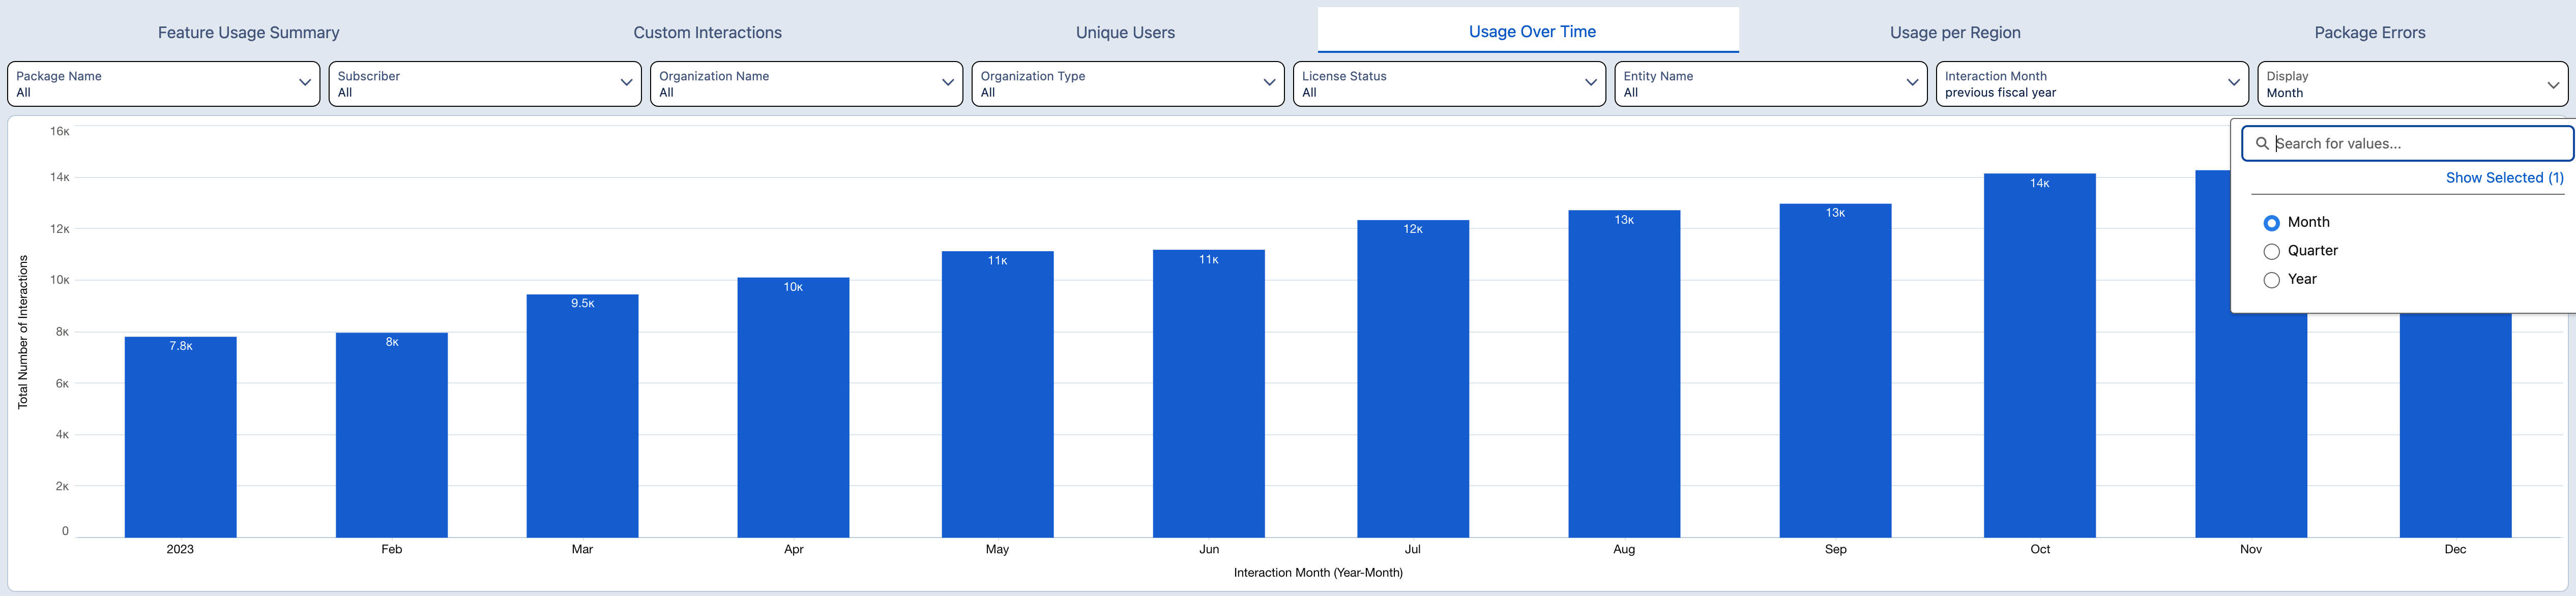
Use Filters for More Specific Results
There is a filter panel at the top of the dashboard that you can use to narrow down the displayed data and save preferred views. To learn more about the filtering options, see this article: Package Usage Overview Filters.