Feature Usage Summary
Available for plans: Standard - Free, Standard, Premium, Enterprise and Ultimate. |
| A CRM Analytics license is required to view and access CRM Analytics assets in Unified Analytics. |
Use the Feature Usage Summary tab of the Package Usage Overview dashboard to monitor how the features of your app are used by your customers.
Open the ISV Analytics app from the app launcher and navigate to Package Usage Overview. Select the Feature Usage Summary tab on the dashboard.
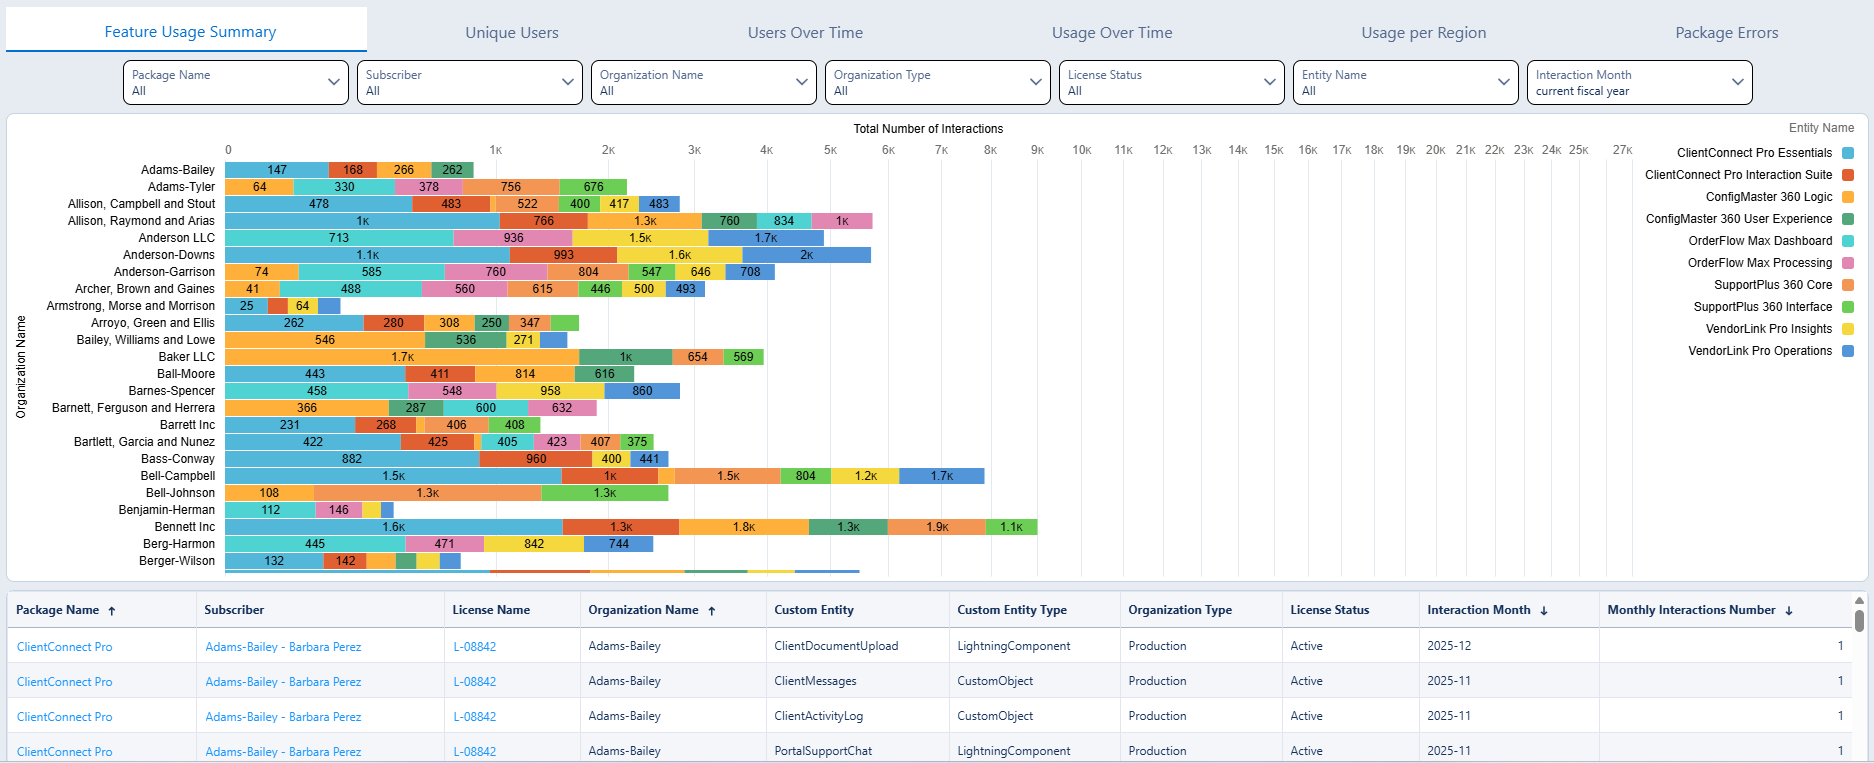
The dashboard displays the total number of interactions with your app's features, grouped by your customers. The table below contains detailed information about the interactions visualized on the dashboard.
Features are the individual components of your app, optionally grouped into feature buckets. To learn how to group components into feature buckets, refer to this article: Group Components Into Buckets for Clean Visualization.
If you're interested in the source of all the data the app visualizes here, refer to the What Data We Use article.
What You Can Do with This Data
Understanding which features are used by your customers and how often can provide many benefits for your business:
- Make more informed product roadmap decisions.
- Identify your most promising subscribers.
- Identify customers who don't use certain features frequently—perhaps you should contact them and ask for feedback.
Use Filters for More Specific Results
There is a filter panel at the top of the dashboard that you can use to narrow down the displayed data and save preferred views. To learn more about the filtering options, see this article: Package Usage Overview Filters.