Churn Prevention
Available for plans: Enterprise and Ultimate. |
| A CRM Analytics license is required to view and access CRM Analytics assets in Unified Analytics. |
Identify and Mitigate Customer Churn Risk
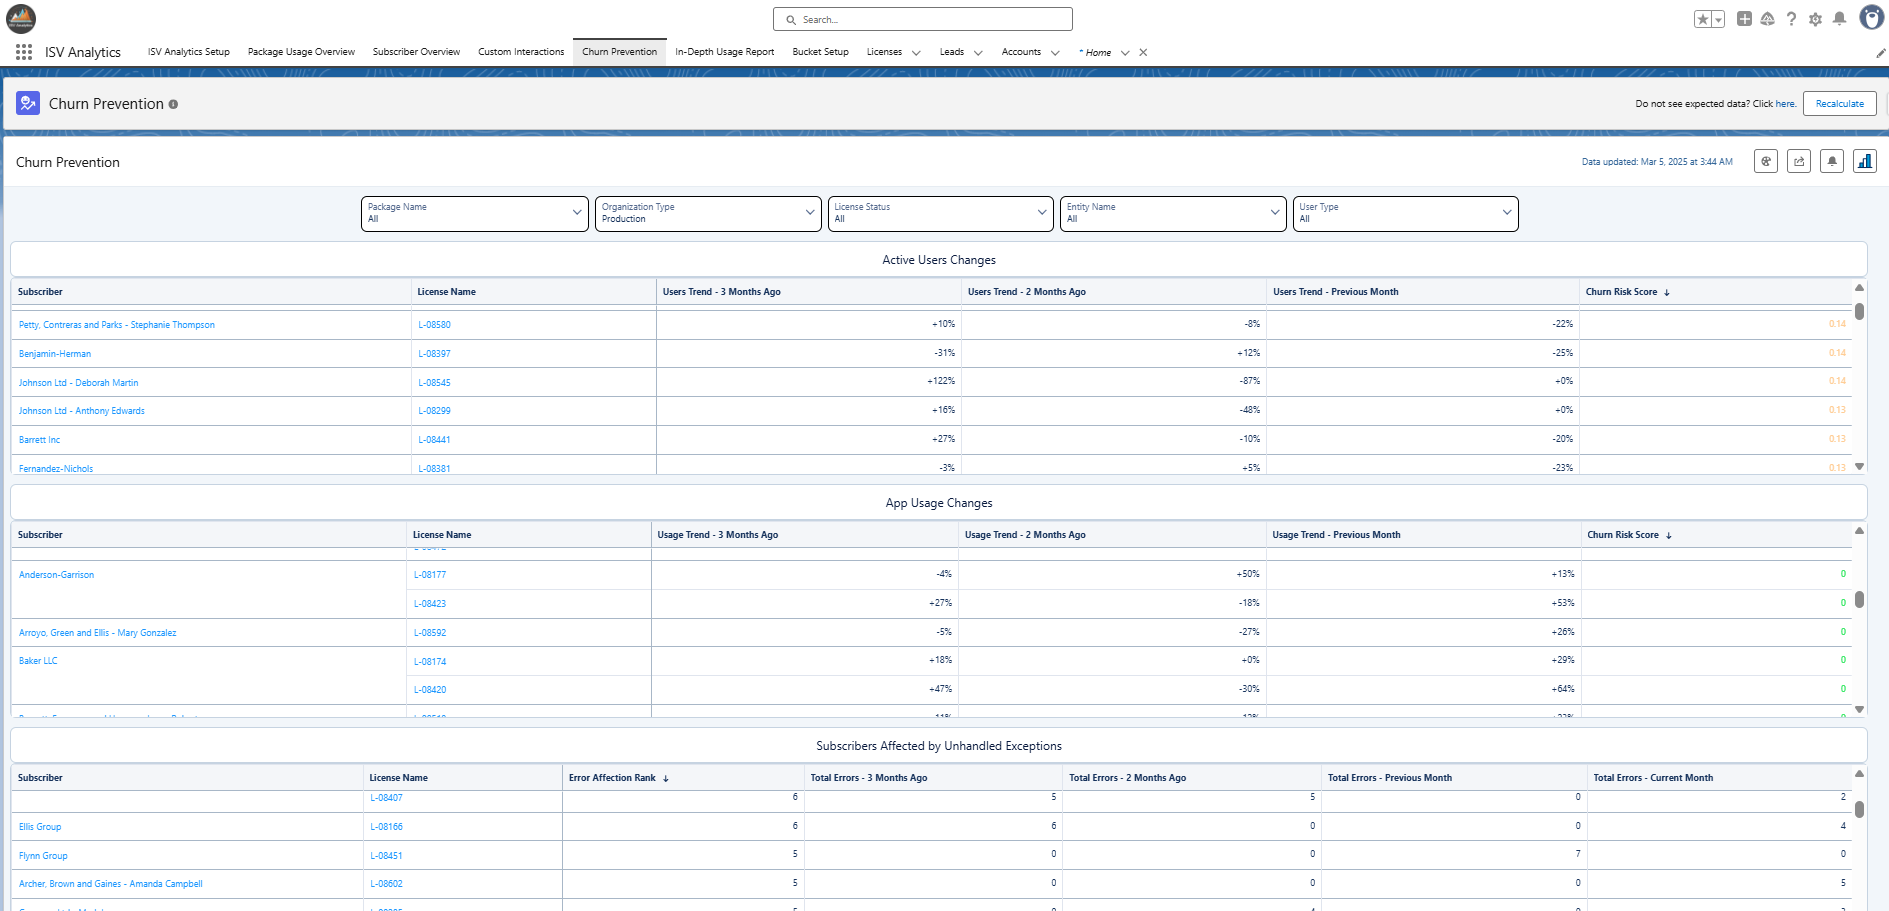
Use the Churn Prevention dashboard to spot customers that might churn and react before it's too late.
Open the ISV Analytics app from the app launcher and navigate to Churn Prevention.
The dashboard displays tables with the calculated risk score for several factors.
Active Users Decrease
You can see active user trends from the last three months here. If there is a significant drop in users actively using your app in a given customer org, this might be a big red flag, meaning the customer is no longer getting as much value from your solution. Time to react quickly!
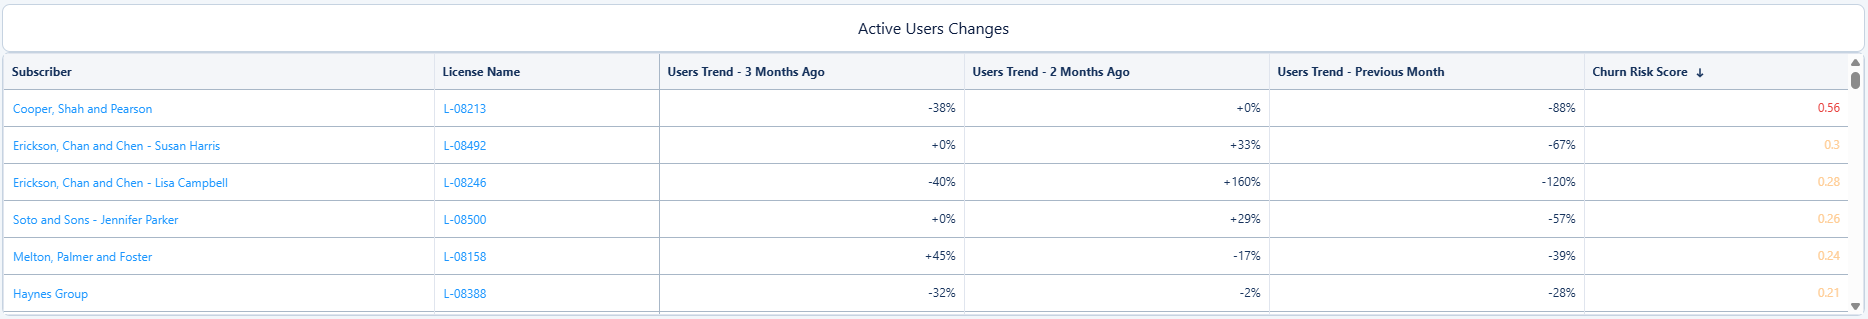
Your customers are sorted by the Churn Risk Score, which is a weighted average of active users number drops in the last three months. This way, the highest risk is associated with the most recent high drops in active users.
It is calculated using the following formula:
Each of the monthly drops is calculated as a difference between the number of active users given month and the average number of users in the last 4 months.
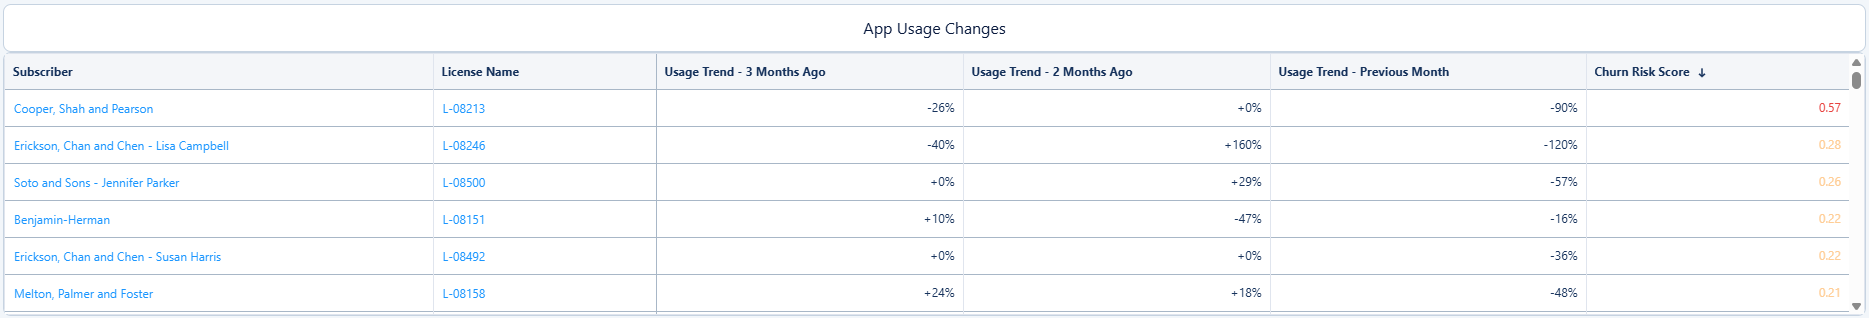
App Usage Decrease
This metric is similar to Active Users Decrease, but it calculates the risk score based on drops in the overall number of interactions with the app.
The details of the calculation are presented below:
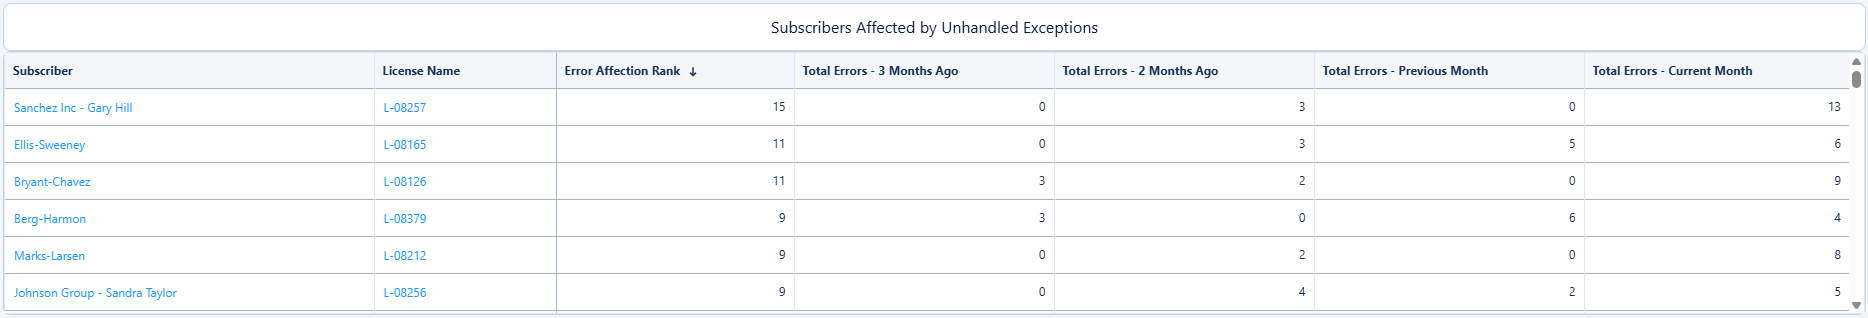
Customers Affected by Errors
When uncaught exceptions occur for your customers, this will probably not increase their loyalty and overall satisfaction. :) It's important to identify the most affected clients before issues escalate (even better if you can spot errors before they do).
The table below shows how many unhandled exceptions occurred for each customer and calculates the Error Affection Score.
Here are the details of the error affection score calculation:
Use Filters to Exclude Irrelevant Data
You might need to narrow down the source data to make the risk score more accurate. Common scenarios include:
- Selecting only specific entities to show usage drops only for meaningful parts of the app (if you want to be very specific, you can select only certain custom interactions).
- Excluding certain types of users from the active user change calculations.
Available filters:
- Package Name – Use this if you have multiple packages and want to show churn analysis for specific ones.
- Organization Type – By default, it is set to Production, but you can also see data for other types of orgs.
- License Status – Status of the customer license.
- Entity Name – Enables you to show usage change analysis only for specific features of your app.
- User Type – Useful for excluding certain types of users in active user change analysis.