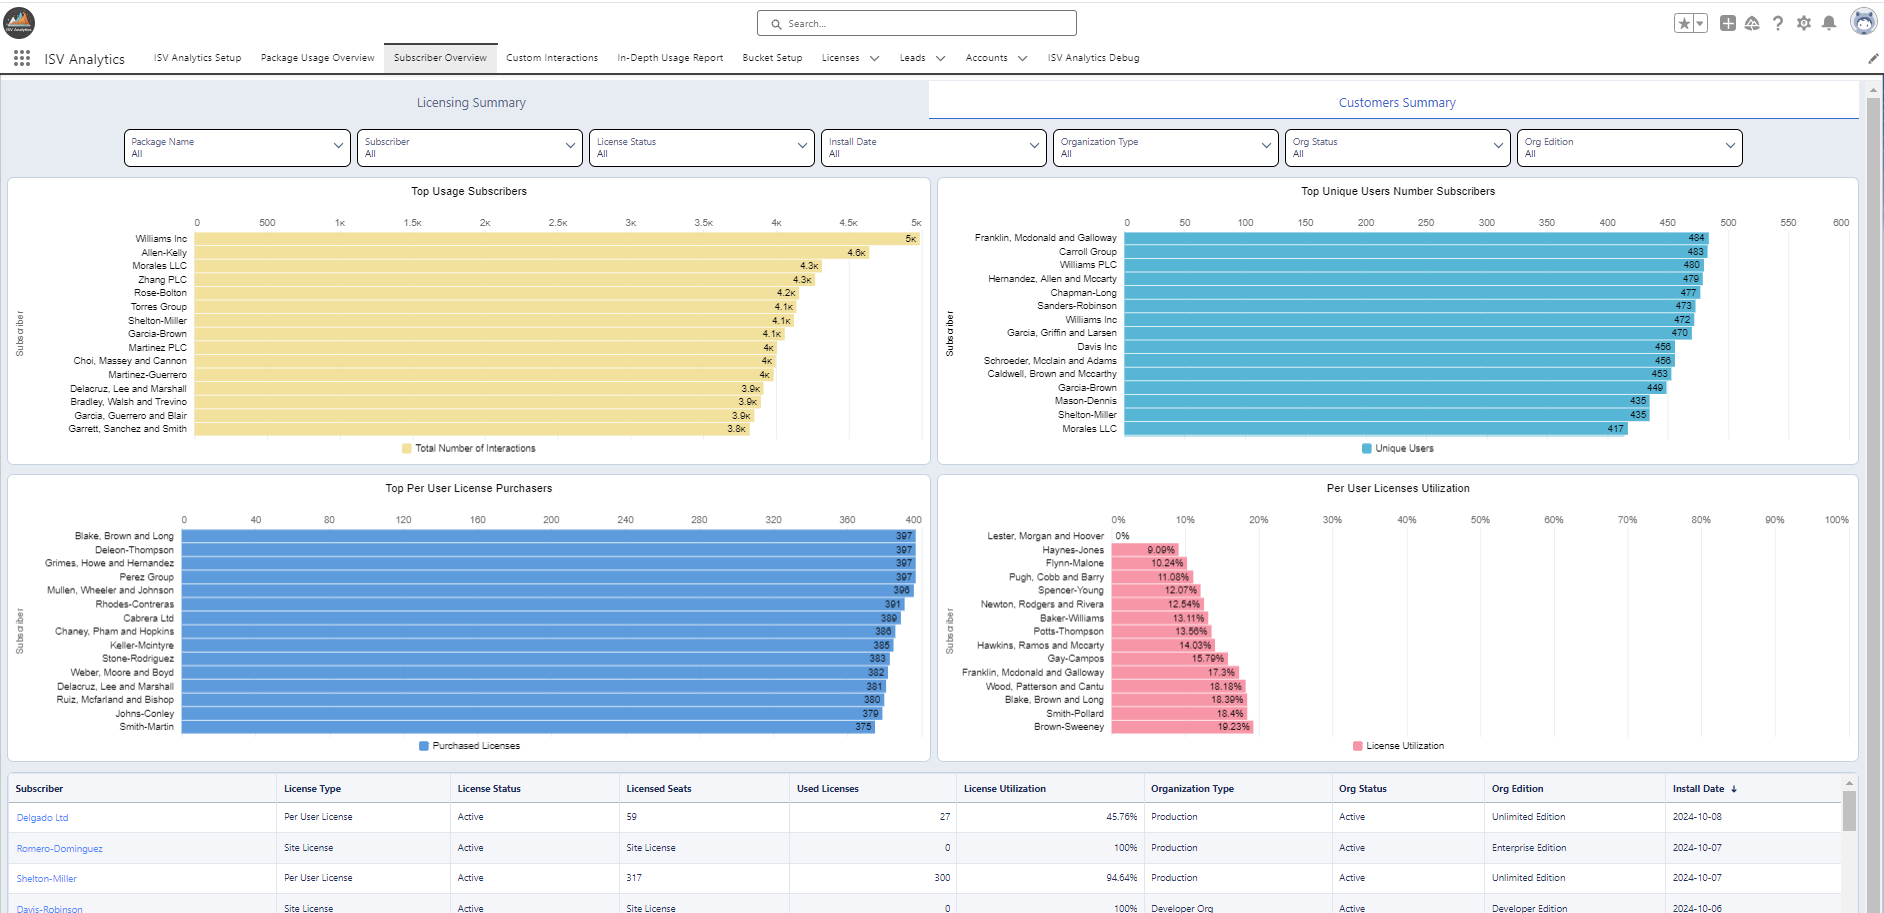
Customers Summary
Available for plans: Standard - Free, Standard, Premium, Enterprise and Ultimate. |
| A CRM Analytics license is required to view and access CRM Analytics assets in Unified Analytics. |
Identify Top Customers and Monitor License Statistics & Utilization
Use the Customers Summary tab of the Subscribers Overview dashboard to identify top license purchasers, monitor customer health, and see your license type breakdown.
Open the ISV Analytics app from the app launcher and navigate to Subscribers Overview. Select the Customers Summary tab on the dashboard.
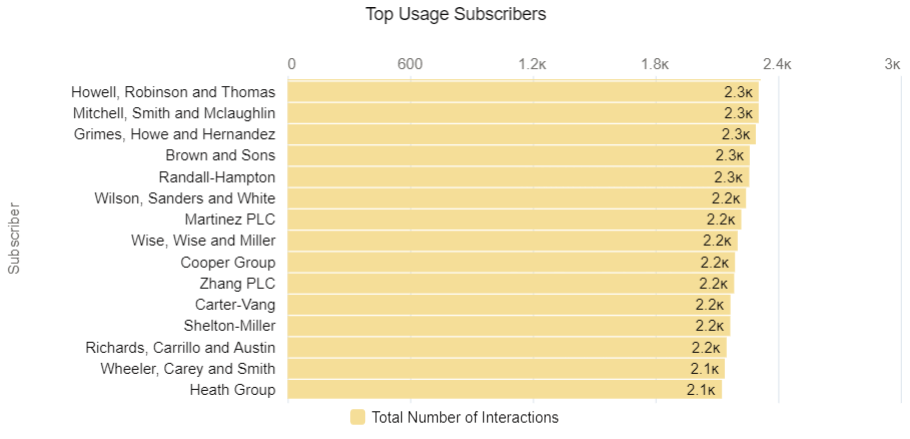
Top Usage Subscribers
This chart displays the customers who use your app most frequently.
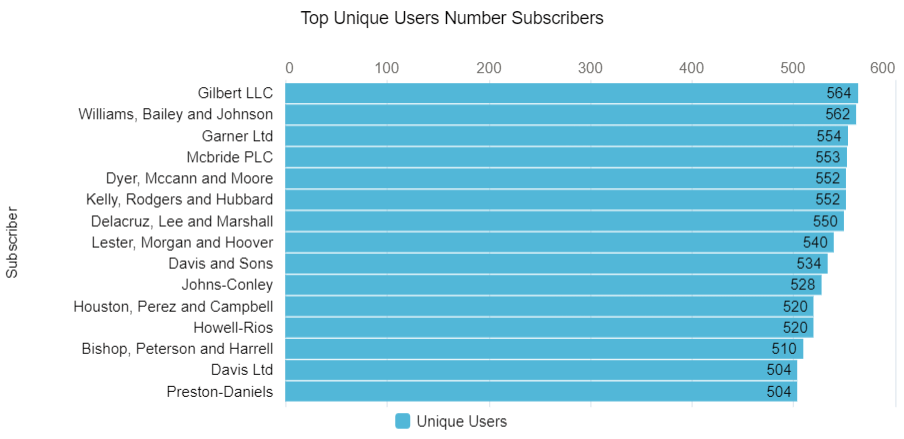
Top Unique Users Number Subscribers
This diagram shows the customers with the highest number of active users engaging with your app.
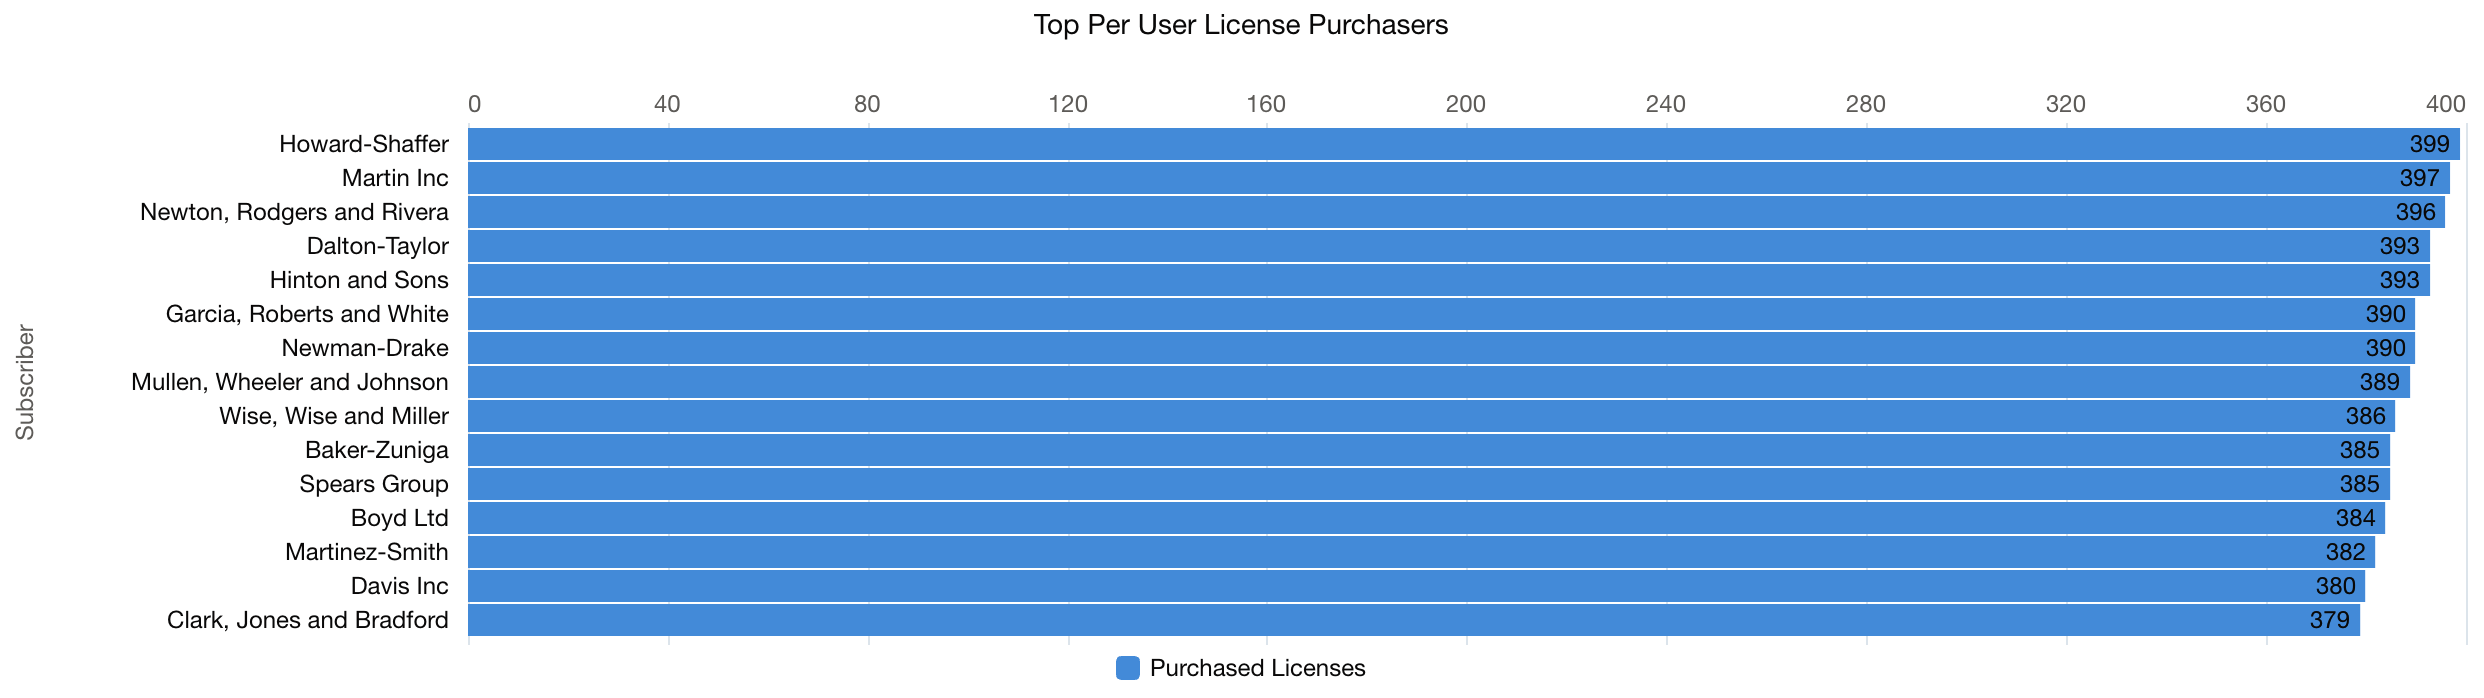
Top Per-User License Purchasers
If you distribute per-seat licenses, different customers may buy different numbers of seats. This diagram shows your top purchasers.
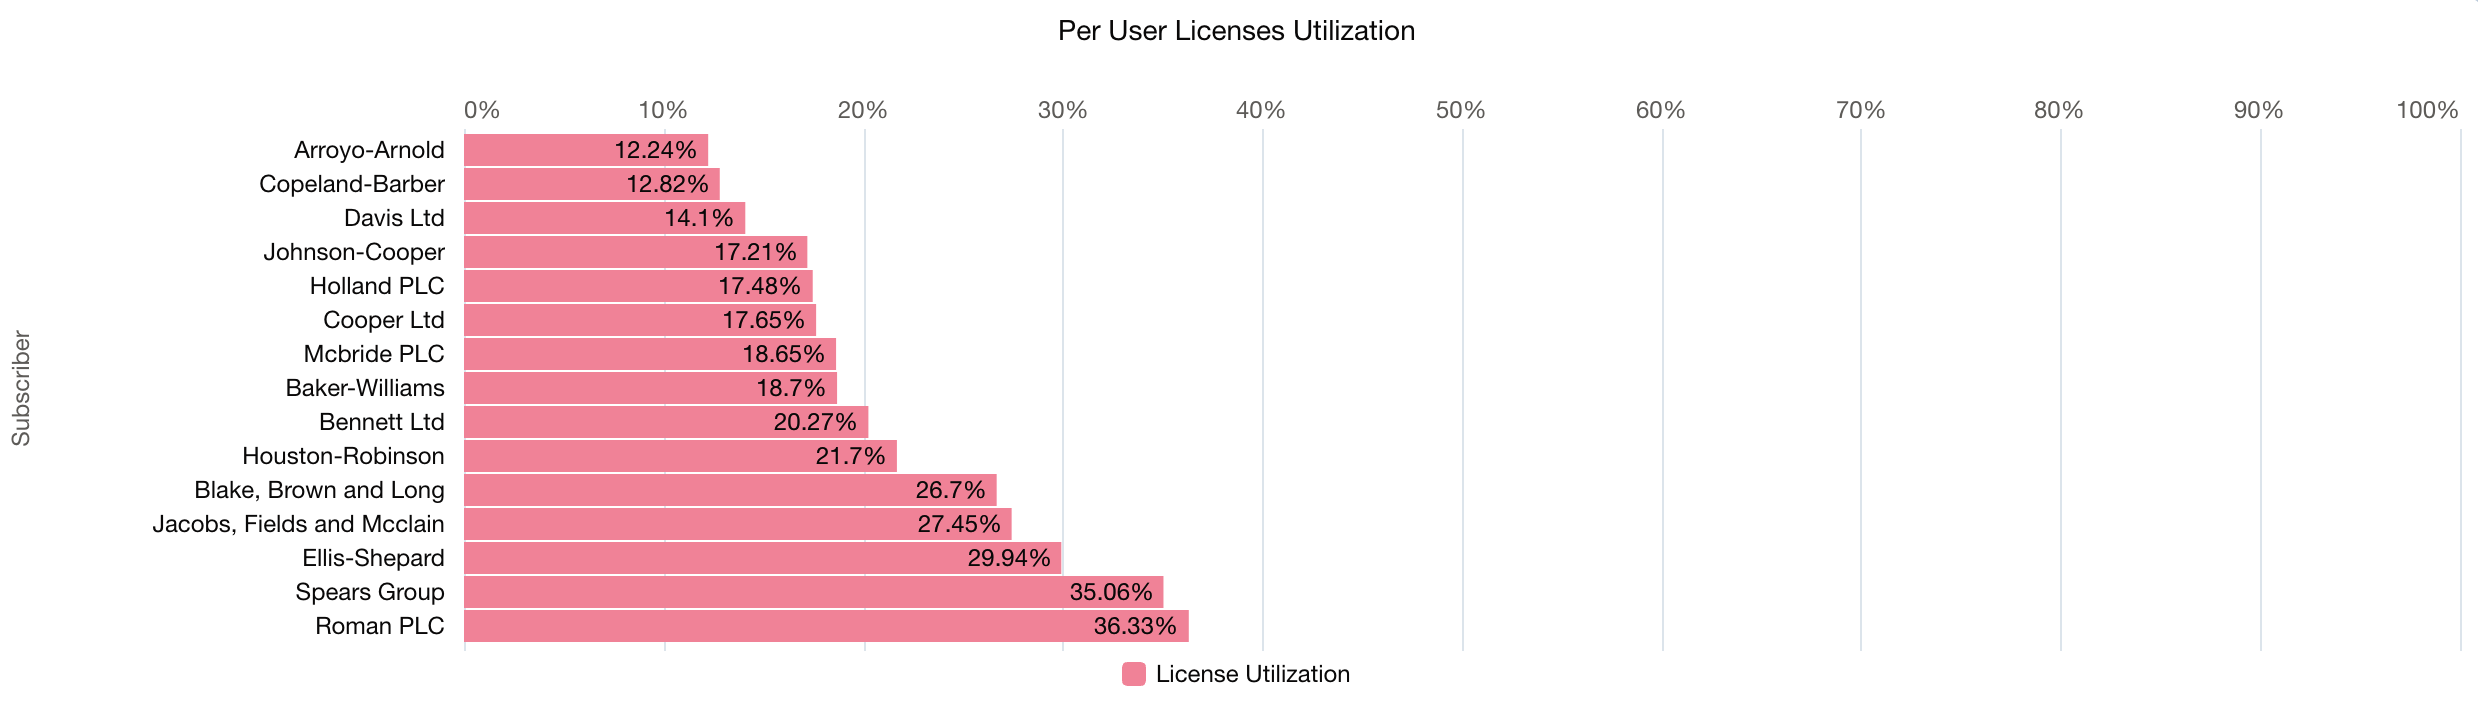
License Per-User Utilization
Ensure that your clients are using the licenses they purchased. If a customer bought a certain number of per-seat licenses of your app and most of them are not assigned to any users, this is a red flag for you. You may need to check whether they are facing some issues, are not satisfied with the app, or are waiting for some decisions on their end to get started.
The diagram shows you the license utilization score (number of assigned licenses divided by total purchased licenses) for all your customers.
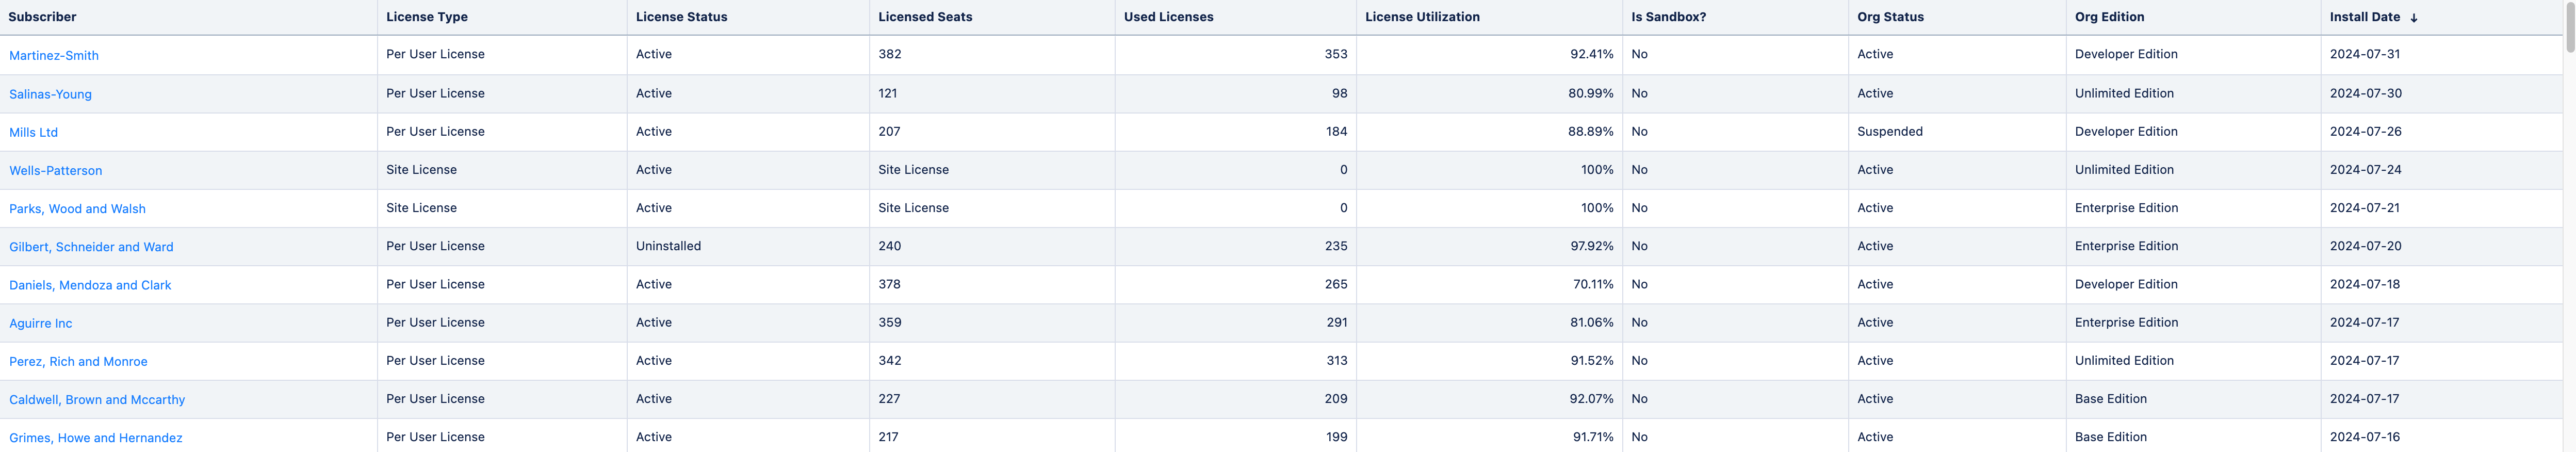
License Detail Information
The bottom table of the dashboard shows detailed information about all the licenses provided to your customers. You can click on the Subscriber value to open the related customer record (lead or account, depending on whether you follow the lead conversion process) and see the analytics summary for it.
What You Can Do with This Data
Tracking and monitoring the data displayed on the Customers Summary dashboard can help you sustain and develop your ISV business in the following ways:
- Select the best licensing strategy for your product.
- Identify top customers.
- React to license status changes to prevent churn and increase renewal rates.
Use Filters for More Specific Results
The dashboard is equipped with several filters that can help you narrow the displayed data to see more specific results.
- Package Name - If you have published more than one AppExchange app, you can see statistics for all of them at once, or select specific packages of your choice.
- Subscriber - Allows you to display statistics for specific customers.
- License Status - Narrow down results to specific license statuses, e.g., to show statistics only for active or only for trial-version customers.
- Install Date - Define a date range of app installations to see statistics only for the customers that installed the app in the given period.
- Organization Type - Choose whether to display statistics for production environments, sandboxes, or both.
- Org Status - Some production orgs may be in trial status. You can filter to include or exclude orgs based on their specific statuses.
- Org Edition - Filter by specific organization editions. This is useful for narrowing results, such as excluding Developer Edition orgs from production data (Salesforce classifies Developer Editions as production types).