Customer Summary
Available for plans: Standard - Free, Standard, Premium, Enterprise and Ultimate. |
| A CRM Analytics license is required to view and access CRM Analytics assets in Unified Analytics. |
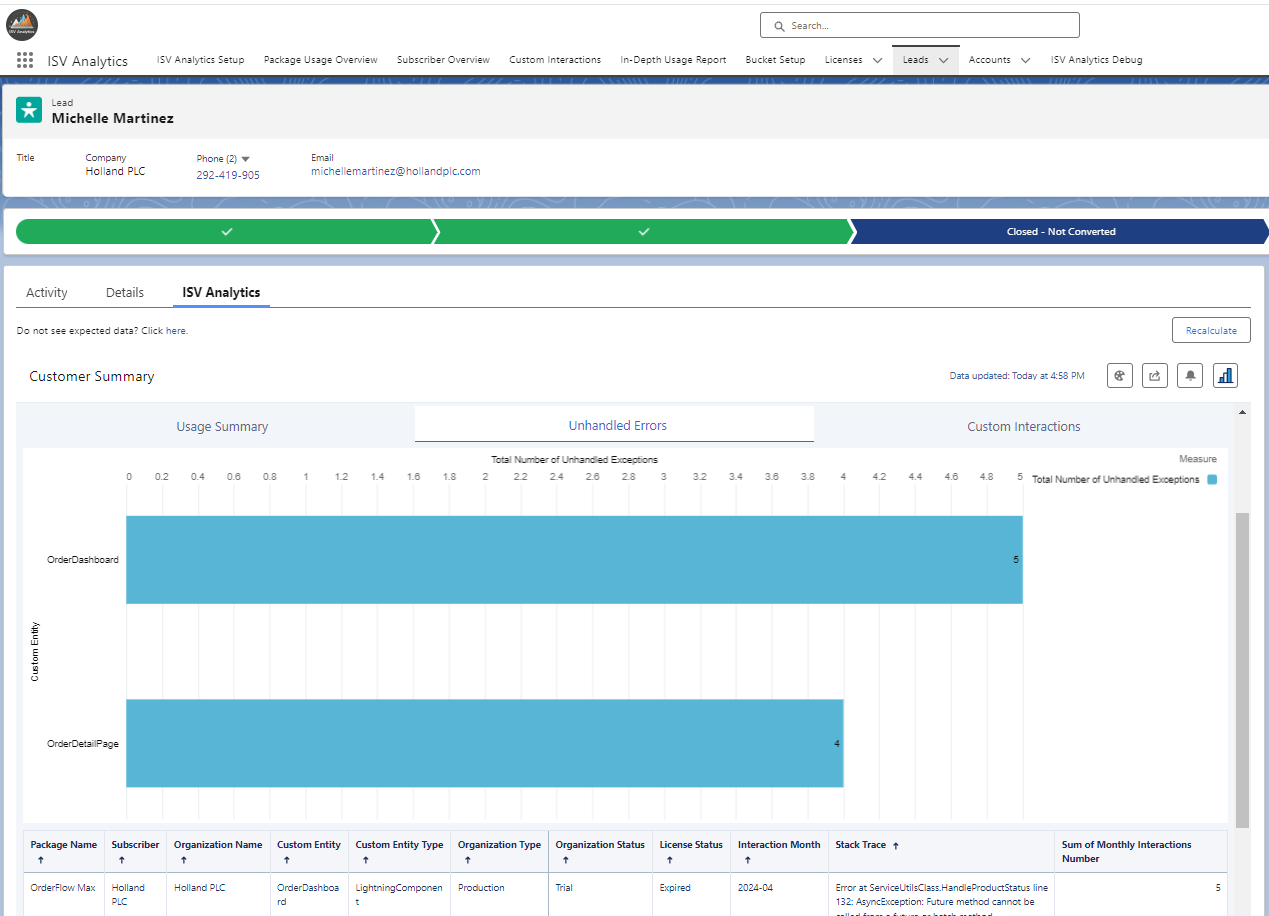
Use the Customer Summary dashboard to monitor how a specific customer uses your app, what license they're using, and whether any exceptions occurred.
The customer summary is embedded on the account and lead record pages, allowing you to see all the relevant data directly from the customer record view. Open the ISV Analytics app from the App Launcher and navigate to the Accounts or Leads tab. Select the account or lead you are interested in.
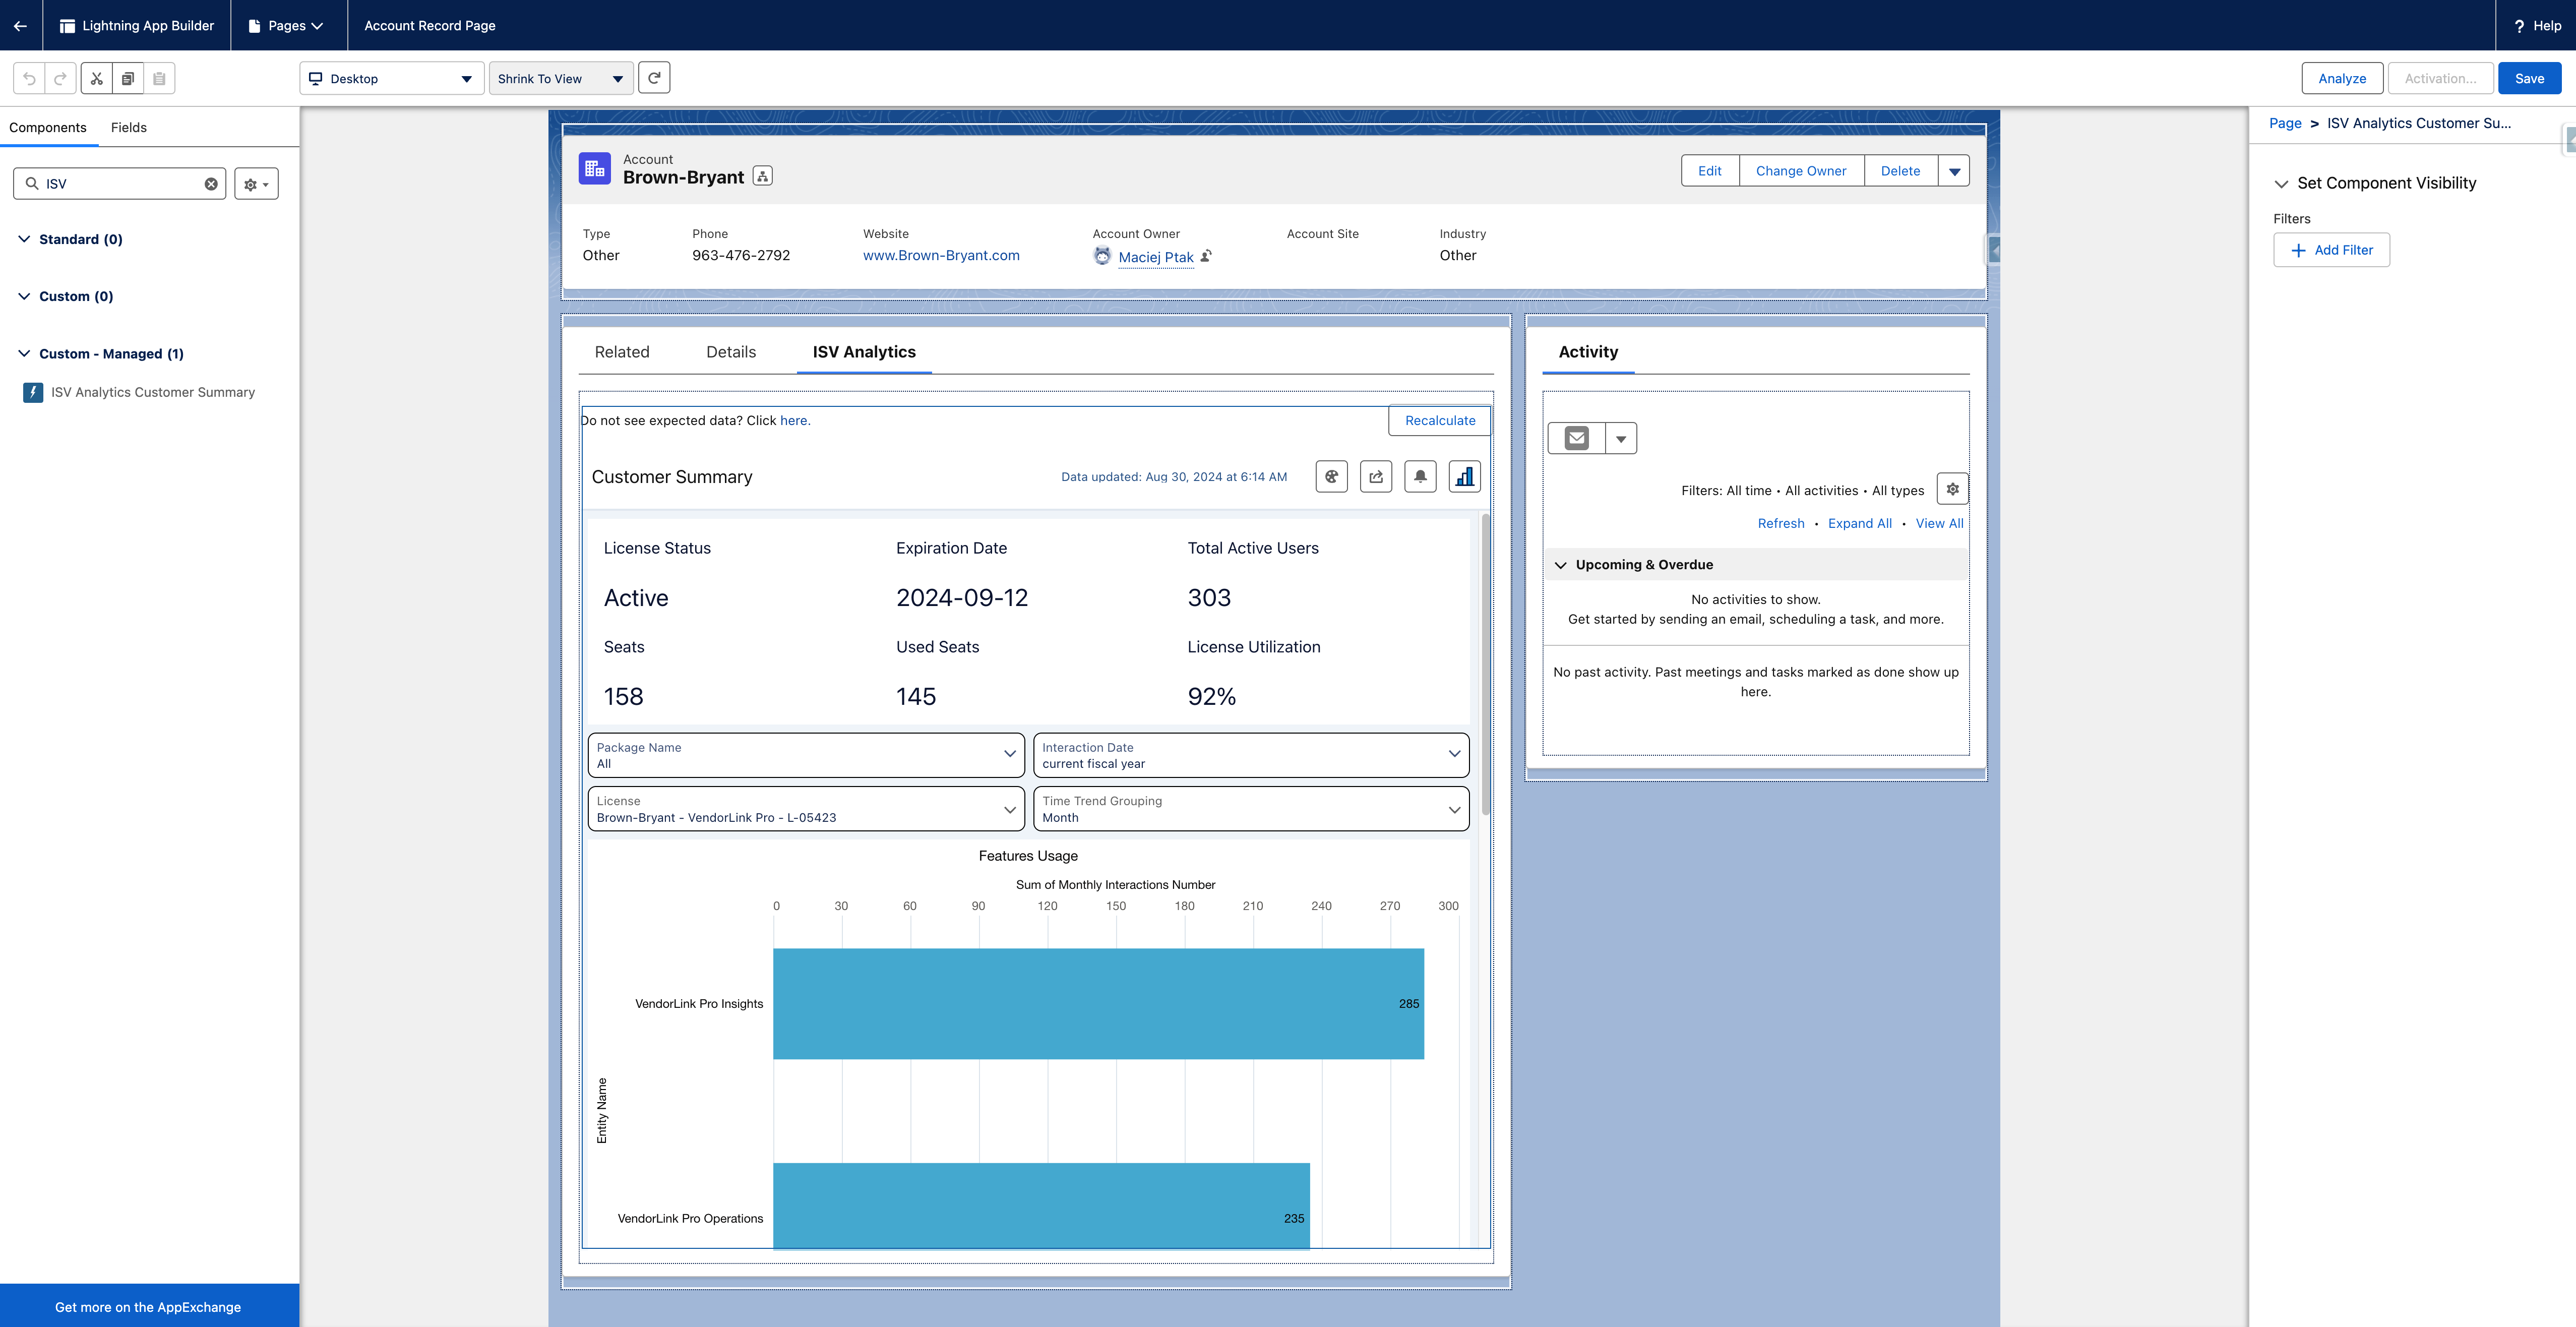
You can find the embedded dashboard under the ISV Analytics tab.
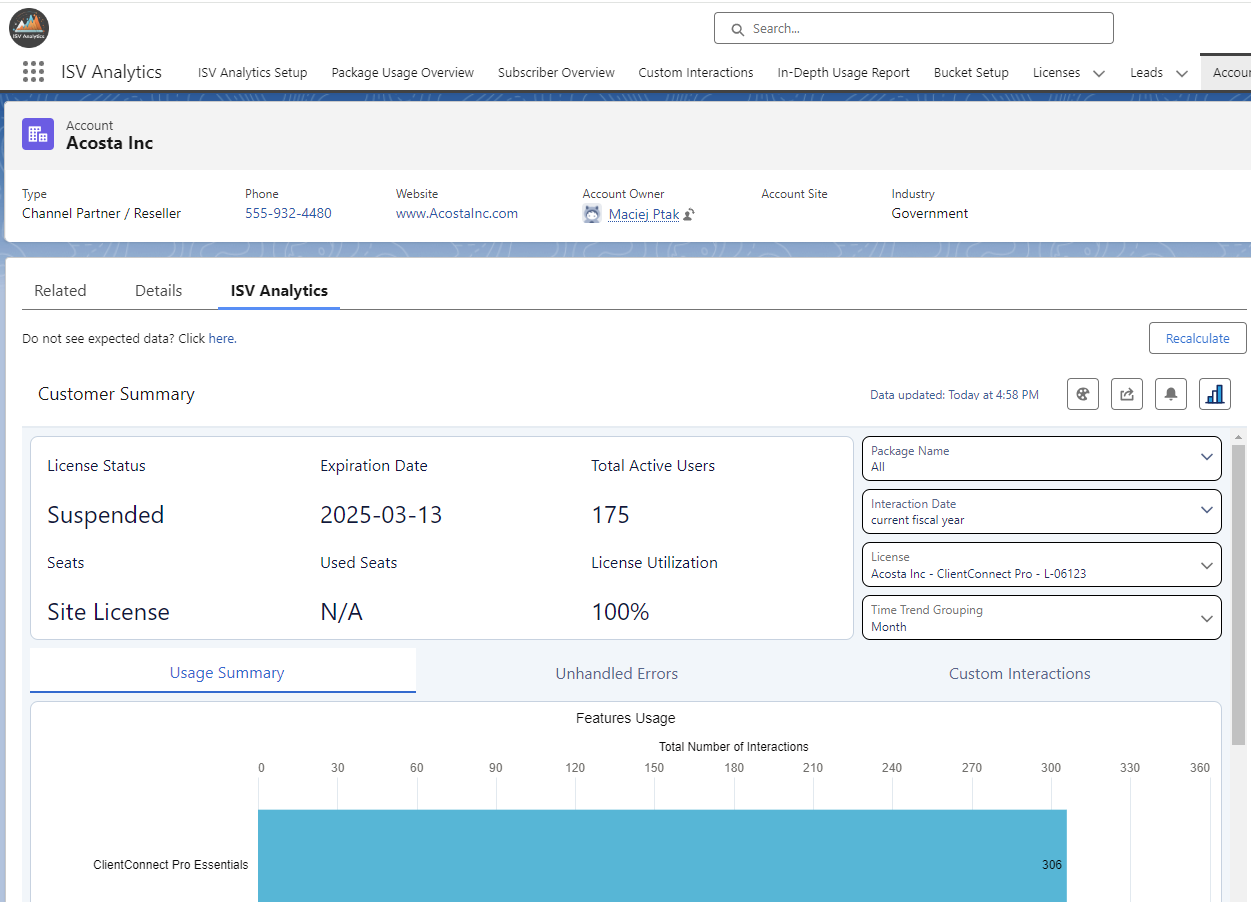
At the top, you can find the following information:
- License Status - Status of the customer license. Can be Active, Trial, Expired or Suspended.
- Expiration Date - Indicates when the current license for your app will expire.
- Total Active Users - Represents how many users are actively using your app.
- Seats - Refers to the total number of available licenses or “seats” that have been purchased or allocated for use.
- Used Seats - Shows the number of seats that are currently in use.
- License Utilization - Provides a percentage that represents the ratio of used seats to total available seats.
Below, there are separate sections dedicated to different metrics visualizations.
Usage Summary
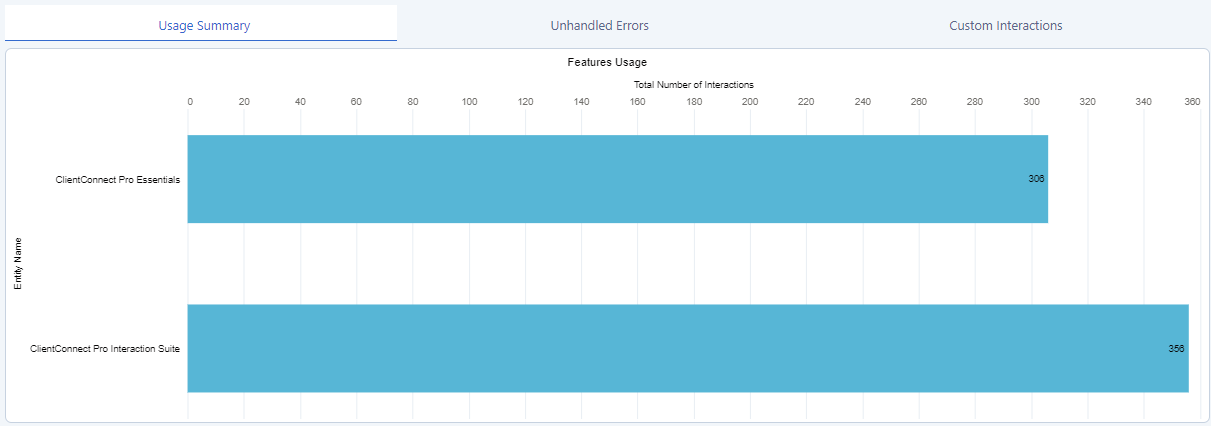
The first section of the Customer Summary dashboard displays data related to how the customer is using your app. It consists of the following components:
- Features Usage - This chart breaks down the total number of interactions within the app, categorized by specific features. It displays interactions grouped by feature names.
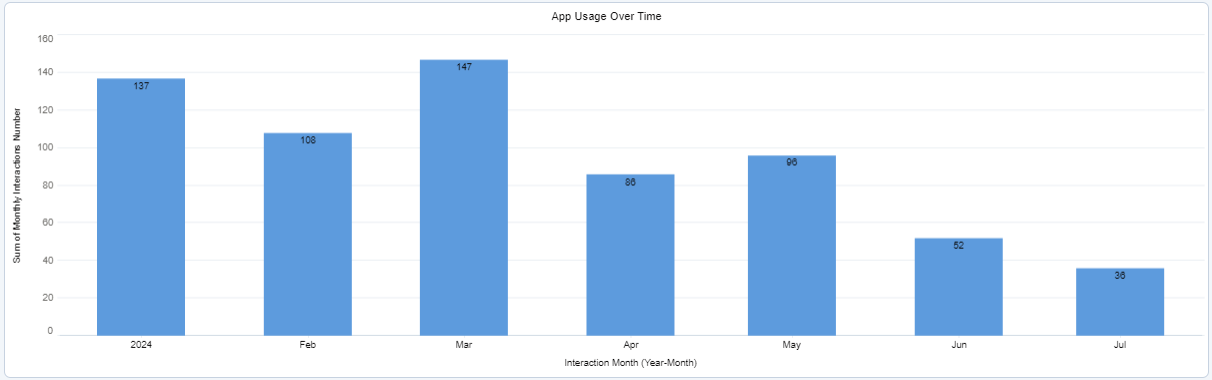
- App Usage Over Time - This visualization shows the overall app usage trend. It can be configured to reflect different groupings—monthly, quarterly, or yearly.
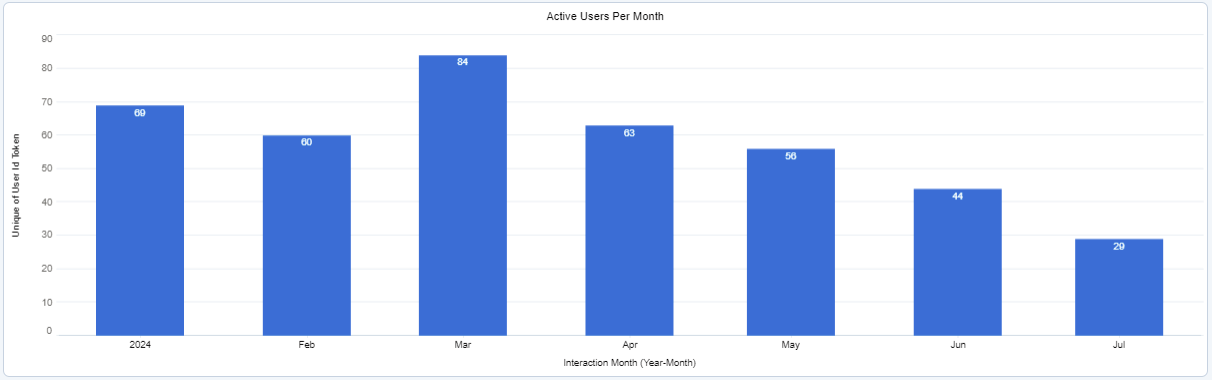
- Active Users Per Month - Displays how the total number of app users has changed over time in this customer's org.
Unhandled Errors
You can check whether any uncaught errors occurred for the customer by navigating to the Unhandled Errors section.
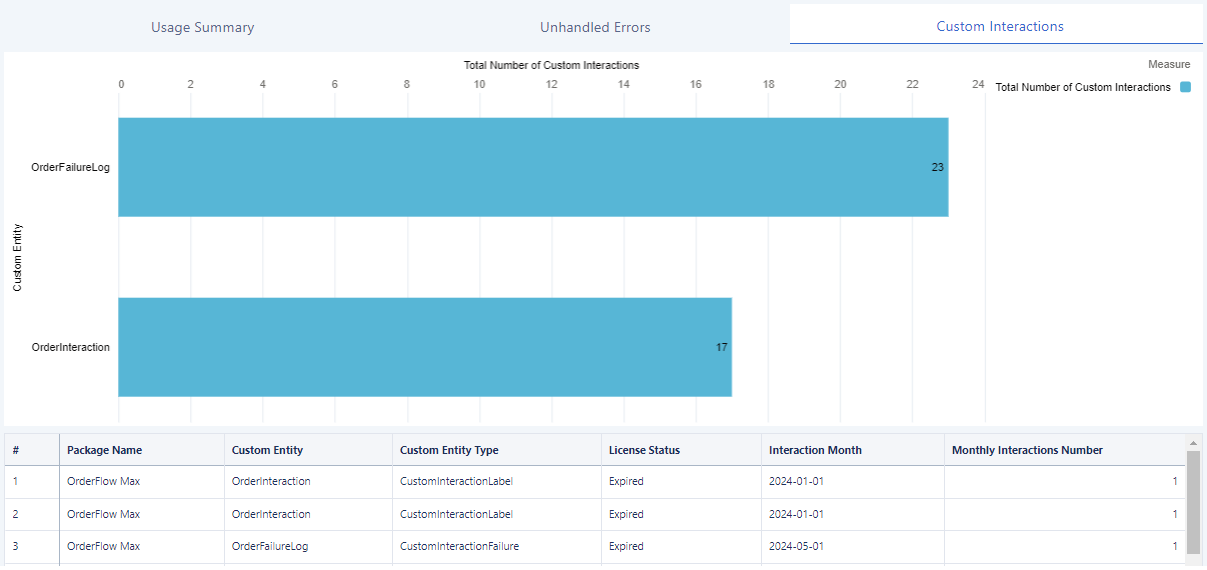
Custom Interactions
Finally, you can also visualize any custom events logged by your app that occurred for the specific customer. Navigate to the Custom Interactions section to access this visualization.
Use Filters for More Specific Results
There is a filter panel at the top of the Customer Summary dashboard that you can use to narrow down the displayed data. It contains the following filters:
- Package Name - If you have published more than one AppExchange app, you can see the usage for all of them at once or select specific packages of your choice.
- Interaction Date - The data visualized on this dashboard is based on the selected period of your app's usage. The Interaction Date filter allows you to narrow the visualized usage date range.
- License - A single account can have multiple licenses. Use the License filter to display information for a specific license.
- Usage Over Time Grouping - It applies to the App Usage Over Time and Active Users per Month diagrams and allows you to group data by Month, Quarter, and Year.
What You Can Do with This Data
The data available in the Customer Summary dashboard provides insights about specific customers that can be useful for your business:
- Monitor Customer Health: Observe whether the customer's app usage is stable and whether they utilize all purchased licenses.
- Prevent Churn: Contact the customer before their license expires. Fix issues causing exceptions before they affect the client.
- Product Roadmap: Observe how your key customers utilize the app and which features they use. Make informed product roadmap decisions.
- Optimize Resource Allocation: Analyze usage patterns by month, quarter, or year to predict future trends and allocate resources more effectively.
Embed Customer Summary on Your Record Page
The Customer Summary dashboard is added out-of-the-box to Account and Lead record pages in the ISV Analytics app.
However, you can add it to your own Account and Lead record pages.
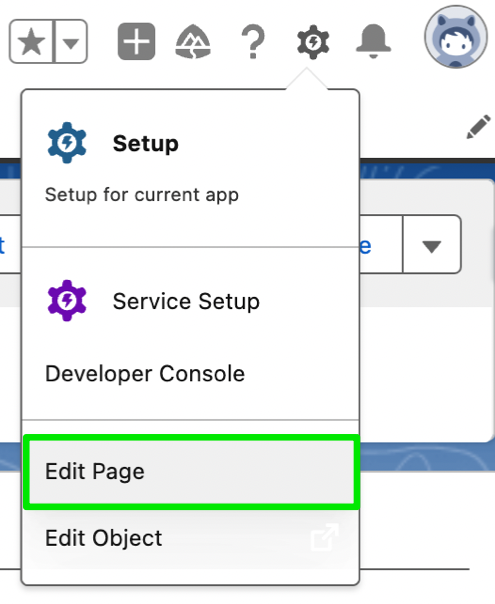
- Open a record page in the Lightning App Builder. You can do this by opening the destination record page and clicking the
Gearicon >Edit Page.
- On the record page, search for
ISV Analytics Customer Summary.
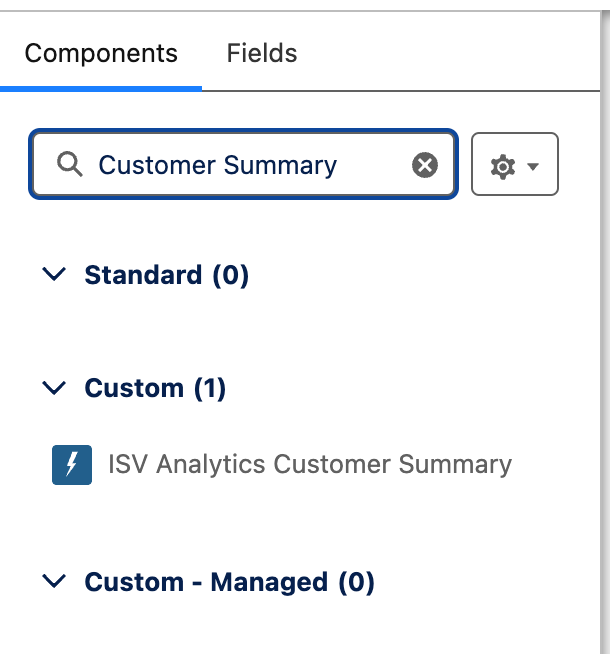
- Drag and drop the
ISV Analytics Customer Summaryonto your record page.
- Click the
Savebutton.